Note
Go to the end to download the full example code
Reference Spectra
This example demonstrates how to reference spectra using Toluene as an example.
Load Toluene Spectra
Start with importing data and creating the DNPLab workspace. The data has been processed and saved in .h5 file.
import numpy as np
import dnplab as dnp

sampleTag = "10 mM TEMPO in Toluene"
file_name_path = "../../data/prospa/toluene_10mM_Tempone/42"
data = dnp.load(file_name_path)

data.attrs["experiment_type"] = "nmr_spectrum"
data = dnp.apodize(data, lw=10)
data = dnp.fourier_transform(data)
Plot Toluene Spectra
Once the data are imported and processed, it is time to plot the 1D spectra.
dnp.fancy_plot(data, xlim=[-20, 20], title=sampleTag)
dnp.plt.show()
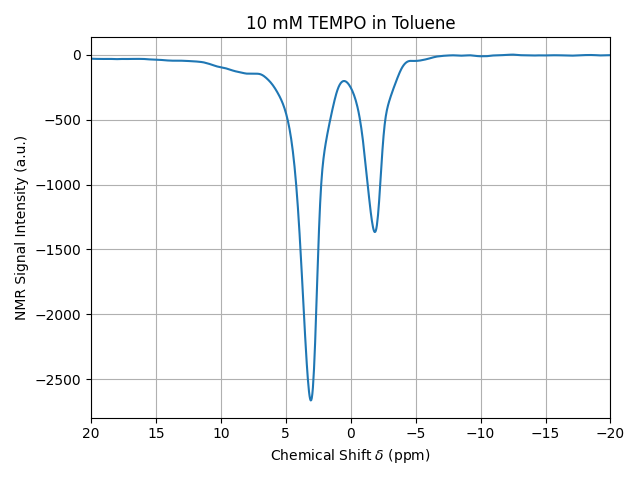
Find Toluene Peaks
In the previous example, we have demonstrated how to find peaks. Now, we apply the DNPLab function find_peaks to get a DNPData object of all peaks.
peaks = dnp.find_peaks(data)
dnp.peak_info(peaks)
/usr/local/lib/python3.8/site-packages/scipy/signal/_peak_finding.py:265: ComplexWarning: Casting complex values to real discards the imaginary part
  value = np.asarray(value, order='C', dtype=np.float64)
Peak #1: Index:  8149, Shift (ppm): -1.84, Height : -1365.46, Width (Hz): 18.91, Width Height: 0.29
Peak #2: Index:  8264, Shift (ppm): 3.09, Height : -2661.71, Width (Hz): 21.76, Width Height: 0.50
--------------------------------------------
Reference Proton Peak
We can see that chemical shift for proton peak is roughly at 2.79 ppm. Let's reference this peak to 7.70 ppm applying the DNPLab function reference.
data = dnp.reference(data, old_ref = 2.79, new_ref = 7.70)

# We can plot the spectra after reference.
dnp.fancy_plot(data, xlim=[-10, 30], title=sampleTag)
dnp.plt.show()
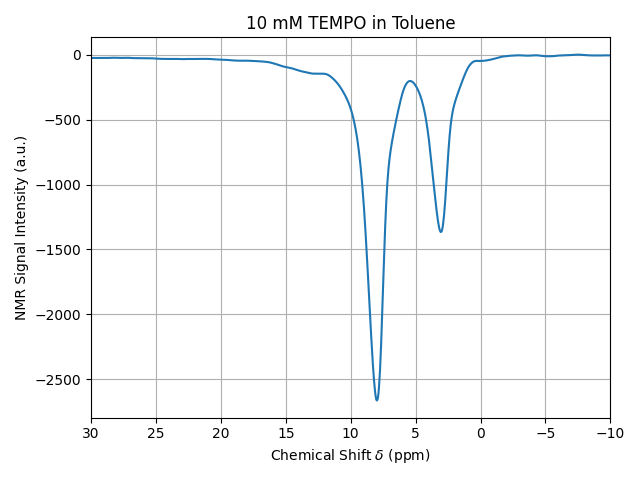
Check the Proton Peak
After we referenced the peaks, we can apply find_peaks functions again to get a DNPData object of all peaks.
peaks = dnp.find_peaks(data)
dnp.peak_info(peaks)
Peak #1: Index:  8149, Shift (ppm): 3.07, Height : -1365.46, Width (Hz): 18.91, Width Height: 0.29
Peak #2: Index:  8264, Shift (ppm): 8.00, Height : -2661.71, Width (Hz): 21.76, Width Height: 0.50
--------------------------------------------
Total running time of the script: (0 minutes 0.268 seconds)